
BABA stock had the biggest IPO for a chinese technology company in the U.S. and had a blockbuster $25 billion IPO. The Amazon of China moved swiftly to capture market share and grow exponentially. But the current regulatory restrictions and the trade war between the U.S. and China, has shaved off billions of dollars of market cap from the internet giant.
The U.S. also has adopted a stricter approach requiring Chinese companies to hand over their financial statements to authorities. Failure to do so could result in delisting of these companies in the U.S. Stock exchanges. Charlie Munger, Warren Buffet’s deputy, has purchased $37 million stock through his company Daily Journal, which is basically a hedge fund in disguise.
Mohnish Pabrai, the famous value investor and a disciple of Warren Buffet also purchased Alibaba stock worth $38 million in his Pabrai funds. Is Alibaba a value stock or a value trap at the current moment? We will take a look at it further here.
Economic advantages for the BABA stock
- There is a wide economic moat. The barriers to entry are high.
- The stock is cheap on fundamentals. We will take a look at the fundamental analysis shortly.
- There is a hidden moat in the Alibaba cloud business, which can accelerate the revenue growth substantially.
- Alibaba also has a one-third stake in Ant financial. Ant is the largest finance and digital wallet company in China and has the Alipay app. Ant group is expected to rake in $1.5 billion in profits each year.
Concerns for the BABA stock
- The biggest concern is the regulatory hurdles from the Chinese government. Alibaba last year was fined a record $2.75 billion dollars for antitrust violations and the Ant IPO was cancelled.
- The ride hailing giant Didi had its IPO in the U.S. Immediately, the Chinese cybersecurity officials ordered the App to stop accepting new customers and removed the App from the App Stores. Existing users could still use the app and Didi has a 90% market share in China and is looking to expand in Europe and Southeast Asia.
- A risk of getting delisted from the U.S. stock exchanges.
BABA Stock Fundamental Analysis
- A Market cap of $575 billion, 52-week range between $198 and $319.
- Current ratio of 1.7, Debt-to-equity ratio of 0.16.
- A price-to-sales ratio of 25. The price-to-book is 4 and a price-to-sales of 5.
- Return of Assets of 17.76% and ROIC of 12.79%. These signify an exceptional business. They can raise prices and have a competitive moat surrounding them.
- Alibaba has $74 billion cash on the balance sheet and a total net debt of $23 billion.
- 40% revenue growth YoY. At this size, it is just phenomenal that the company can grow at a rate of 30 to 40%.
BABA Stock Technical Analysis
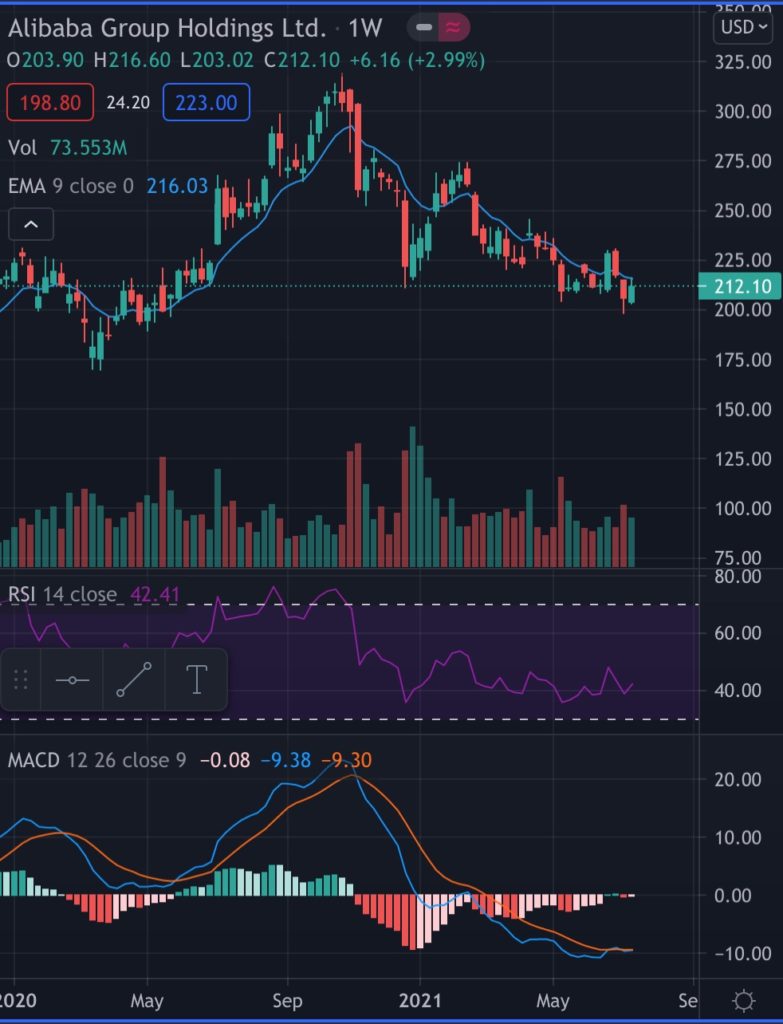
We are using a 9-EMA line on the weekly. We have an All-time high of $319 in October, 2020. We will divide the chart into 2 parts and see how the stock is behaving with respect to the 9 week EMA. If we look prior to Oct 2020, the price always respected the moving average. Even during the pandemic lows, the stock briefly went below but came back up. So we can say that the 9-EMA has acted as the support.
But after Oct 2020, the 9-EMA has acted as a resistance. Each time the price tried to break out, it fell below the moving average. The trend has always been downwards.
The RSI has fallen but still has more room to fall. It has not yet entered the oversold territory. The MACD line has been below the signal line. The gap has decreased and is looking to reverse the trend. But it’s too early. Moreover the MACD is negative. Which means that the 12 moving average is below the 26 moving average. This signifies bearish territory.
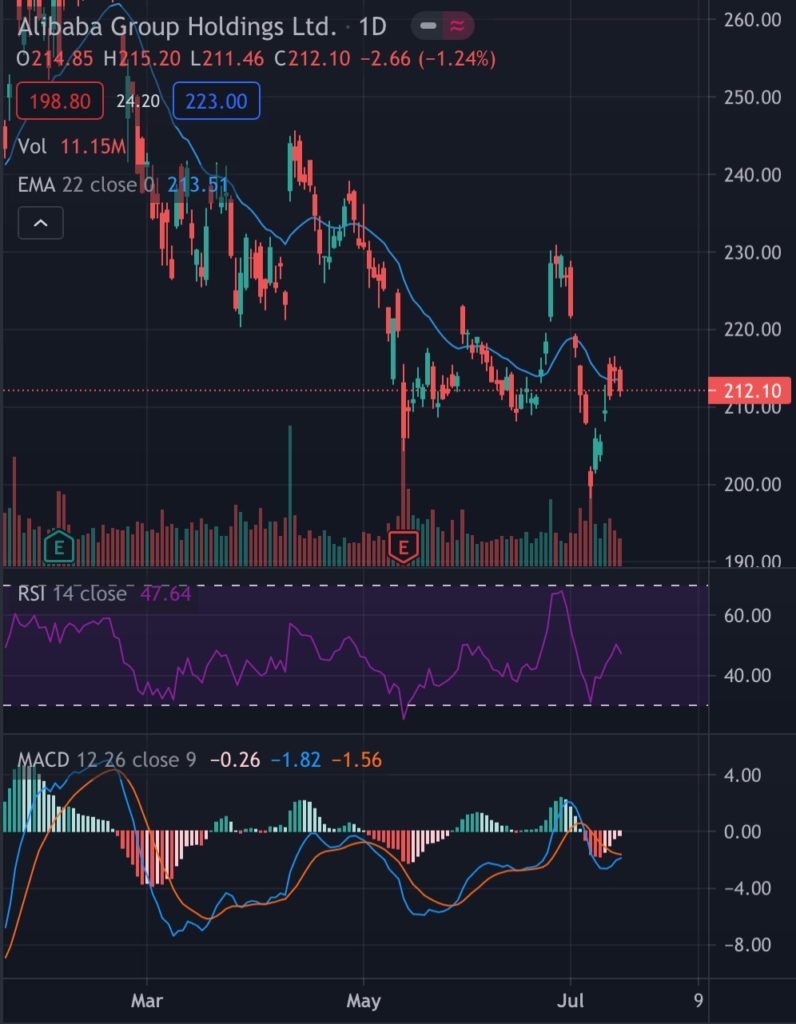
On the daily chart, we are using a 22-EMA. The stock has been in a downward trend. Again the 22-EMA has acted as the resistance rather than the support. There have been 2 breakouts. One during the earnings in Dec 2020. The stellar earnings report caused the stock to post a rise. But quickly came down the EMA. Again during the recent news of Charlie Munger buying $37 million of BABA stock. Then again the stock has fallen back.
The RSI has not yet entered the oversold territory. The MACD line has been below the signal line and is negative. Which means that the 12 moving average is below the 26 moving average. BABA stock is making low highs and low lows each time. This is a bearish pattern. Based on technicals, definitely NOT a buy.
SUMMARY
Due to the risks involved in the regulatory environment, I feel that it is better to pass the BABA stock. There are more options available in the Stock market and its not worth taking the risk.