Baidu Stock is one of the largest AI and Internet companies in the world. Buying Baidu means you are buying the google of China. The company generates 64% of its revenue from ads it shows in its online network. The growth has been sluggish in the past couple of years and investors promptly responded by dumping their shares.
Baidu Products
- The Baidu app allows users to use the search engine and consume information and services which are powered by the Baidu AI. There are 202 million Daily Active Users on the platform. This has been the cash cow for the business.
- The company is looking to move away from its online ad revenue model to a B2B model. Baidu launched the Marketing cloud business. This cloud service allows customers to build their websites on the platform. They can also access a CRM engine that lets the customers build their leads and marketing efforts. The company generated 35% of its ad revenue on the Marketing cloud.
- Baidu is also the pioneer of autonomous driving efforts in China. The company has 199 licenses with extensive geographic coverage, compared to only 20 for its nearest competitor. The Apollo self-driving platform aims to provide Level 3 and 4 autonomous driving for Tier-1 and OEMs. Baidu is also an investor in the EV business with a partnership with Geely Holdings.
Economic advantages for the BAIDU stock
- Baidu is the google of China with a huge moat. It is the largest Internet and AI company in China.
- The stock is cheap on fundamentals. We will take a look at the fundamental analysis shortly.
- The AI cloud may turn out to be the biggest driver of growth. AI is one of the disruptive trends of the future. Baidu has access to huge amounts of data to train its cloud and capture more business.
Concerns for the BAIDU stock
- The biggest concern is the regulatory hurdles from the Chinese government.
- The ride-hailing giant Didi had its IPO in the U.S. The Chinese cybersecurity officials ordered the App to stop accepting new customers and removed the App from the App Stores. Existing users could still use the app and They are expected to slap a fine bigger than Alibaba‘s on Didi.
- There is a risk of getting delisted from the U.S. stock exchanges.
BIDU Stock Fundamental Analysis
- A Market cap of $61 billion, 52-week range between $114 and $354.
- Current ratio of 2.86, Debt-to-equity ratio of 0.33.
- A price-to-earnings of 8.06, price-to-sales ratio of 3.5. The price-to-book is 0.34 and a price-to-sales of 3.51. Fundamentally, it is very cheap and definitely a value stock.
- Return of Assets of 25% and ROIC of 17%. These signify an exceptional business. They can raise prices and have a competitive moat surrounding them.
- Baidu has $25 billion cash on the balance sheet and a total net debt of $9 billion.
- Unfortunately, the revenue growth has been pretty stagnant. So this is not a growth story by any means.
BAIDU Stock Technical Analysis
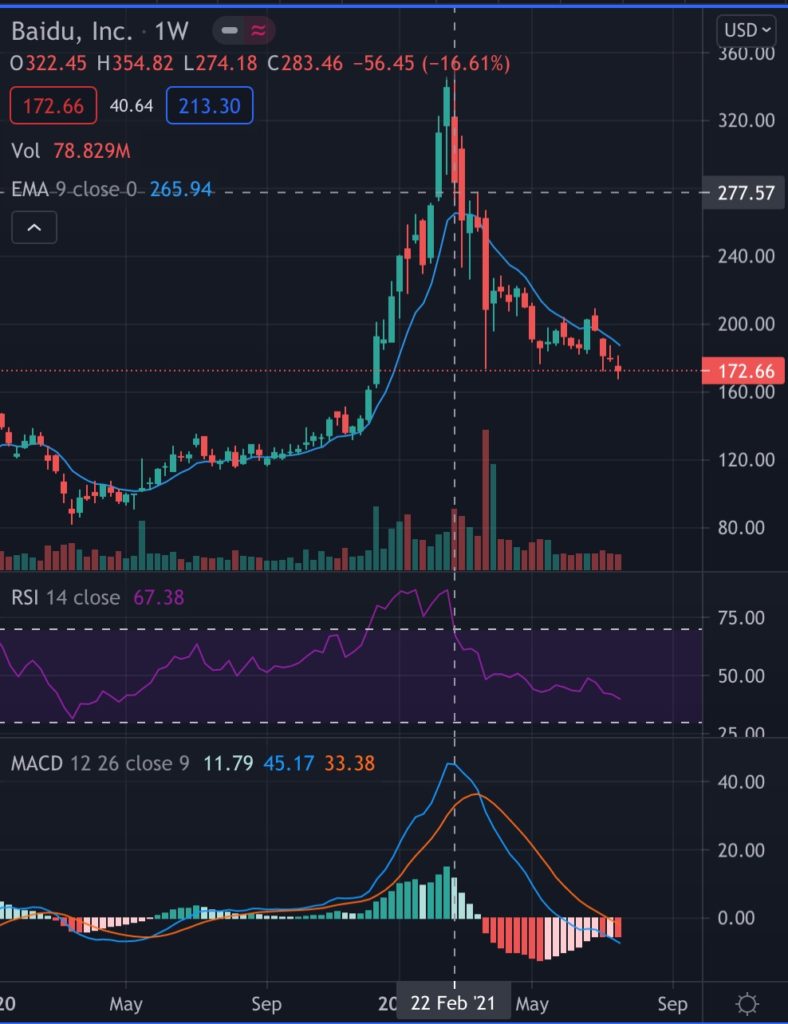
We are using a 9-EMA line on the weekly. The All-time high of $354 in February, 2021. We will divide the chart into 2 parts and see how the stock is behaving with respect to the 9 week EMA. If we look prior to February, 2021, the price always respected the moving average. Even during the pandemic lows, the stock briefly went below but came back up. So we can say that the 9-EMA has acted as the support.
But after the all time high, the 9-EMA has acted as a resistance. Each time the price tried to break out, it fell below the moving average. The trend has always been downwards.
The RSI has fallen but still has more room to fall. It has not yet entered the oversold territory. The MACD line has been below the signal line. The gap has decreased and is looking to reverse the trend. But it’s too early. Moreover the MACD is negative. Which means that the 12 moving average is below the 26 moving average. This signifies bearish territory.

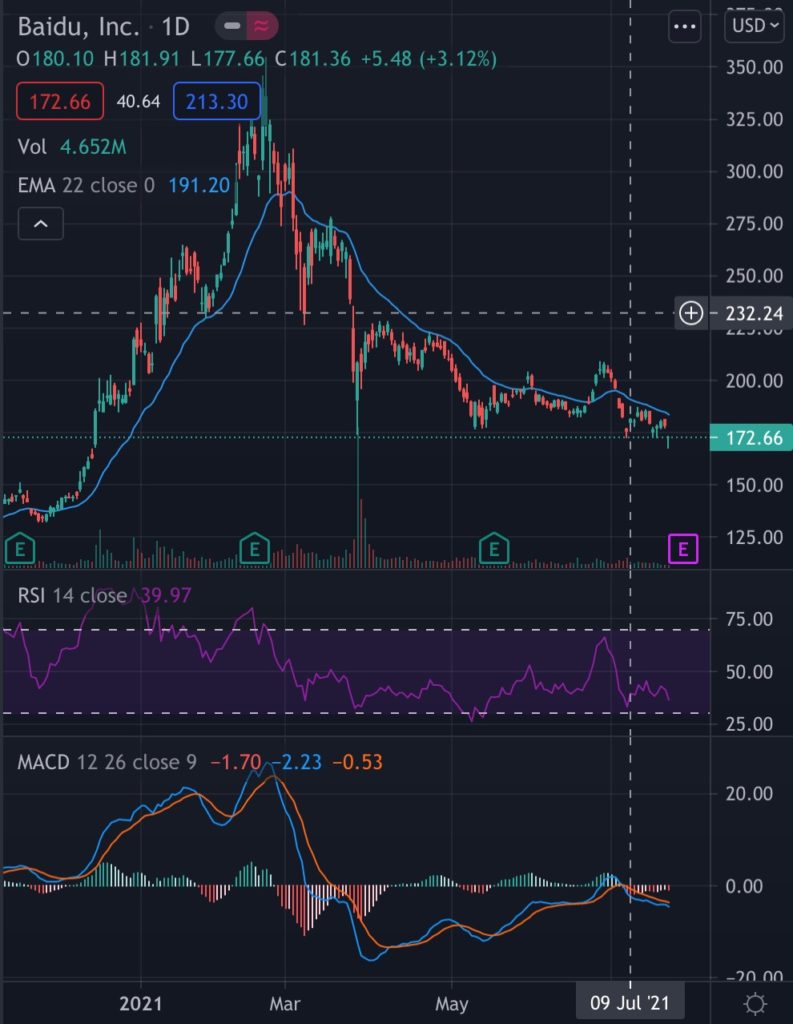
On the daily chart, we are using a 22-EMA. The stock has been in a downward trend. Again the 22-EMA has acted as the resistance rather than the support. There has been one breakout. But quickly the price came down.
The RSI has not yet entered the oversold territory. The MACD line has been below the signal line and is negative. Which means that the 12 moving average is below the 26 moving average. BIDU stock is making low highs and low lows each time. This is a bearish pattern. The stock has broken its support at $172. The next support is at $140. Based on technicals, definitely NOT a buy.

SUMMARY
Baidu stock is in a bear pattern, making low highs and low lows. The revenue growth has also been sluggish, though analysts expect the revenue to grow at 20 to 30% rate this year. This is a value stock, but may turn into a value trap. With the risks of trade wars and escalating tensions, it is better to skip the Baidu stock at this moment.

