
AI Stock is an attractive price point, both technical and fundamental. C3.ai is an Enterprise AI software company. C3 CEO Tom Siebel, who sold his company Siebel Systems to Oracle for $6.1 billion in 2006, founded C3 in 2009. Siebel joined Larry Ellison at Oracle in 1983. He saw the huge market for the Relational databases before the Information technology revolution started. After Oracle was positioned to take advantage of this boom, he saw another opportunity for automation of business processes of sales, marketing, and customer service.
In 1993, he founded Siebel Systems. He literally invented the CRM market, which is a $60+ billion software industry. After riding this wave, Mr. Siebel envisioned a step function of technologies like elastic cloud computing, big data, the internet of things, and AI. The confluence of these technologies would usher in an era of digital transformation like none other. This is what C3 AI is positioned to capture now.
Inflation fears hammer growth stocks
The past week has been really stomach churning in the stock market. The consumer price index rose by 4.2% year over year. This is the highest climb since 2008. This has brought the fear of inflation. All the money printing that happened is not going to be free after all.
On this news, the markets had corrections and the growth stocks were especially hit. The reason is that as inflation rises, wages have to increase and the corporate profits decrease. Another reason is that the Fed cannot run their money printing machine as inflation rises. They will have to raise the interest rates, which is again negative for stock prices.
The markets calmed down on Friday and posted some recovery. This has brought a few opportunities for swing trades. Today I will discuss the stock I am looking to trade during the week ahead. I will give a detailed plan of how I am planning to trade.
AI Stock fundamental analysis
The company has a Net zero debt. This is really healthy, especially if the interest rates go up in the future. The company has no debt payments to make. The Current ratio is 11.21. The current ratio is the current assets divided by the current liabilities. This gives an idea of the working capital. Anything about 1.5 is very healthy. The company has enough working capital and is flush with cash from the IPO proceeds.
AI has a price to sales to 30. This is a bit expensive so I think fundamentally the company is still overvalued. The price to book is 4.88. A P/B of under 1.5 usually shows fundamentally cheap stocks.
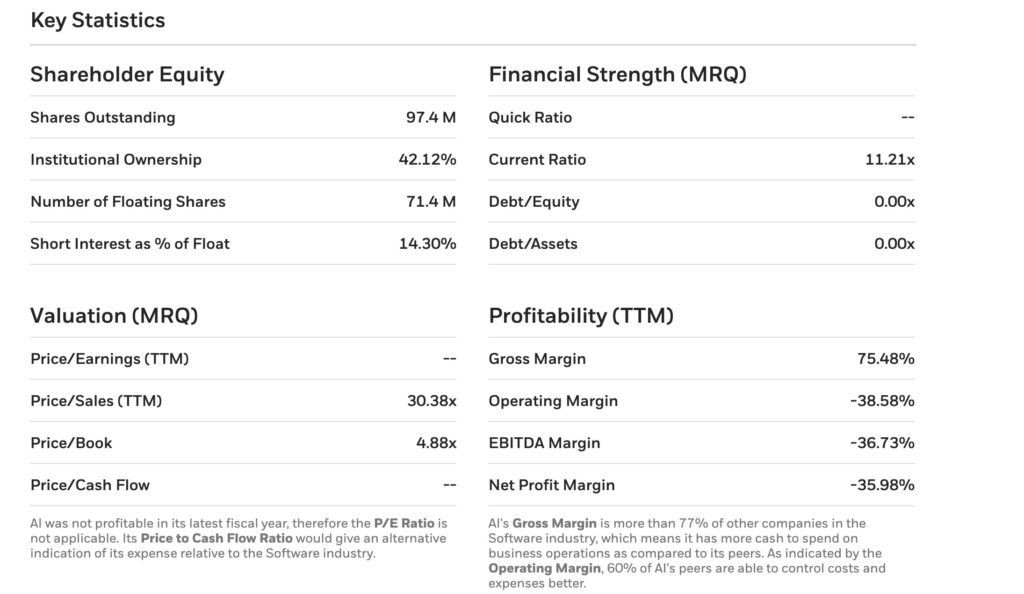
The company achieved a revenue growth of 71% YoY. The revenue is $157M with a net loss of about $70M in the year ending April 2020. The gross margin is greater than 60%. The bulk of costs are around Sales and Marketing, R&D, and General and administrative expenses.
For a 3 year valuation, let’s assume a growth rate of 50%. $157M revenue compounded over 3 years at 50% results in $530M. We are not sure if the company can be profitable during that time, so we can eliminate the net income calculation. Since this is priced as a growth company, a multiple of 15 could be applied to the revenue. That gives it a $7.95B valuation. Divide by the shares outstanding of 96.4M, this gives $7.95B / 96.4M = $82 per share.

AI Stock technical analysis
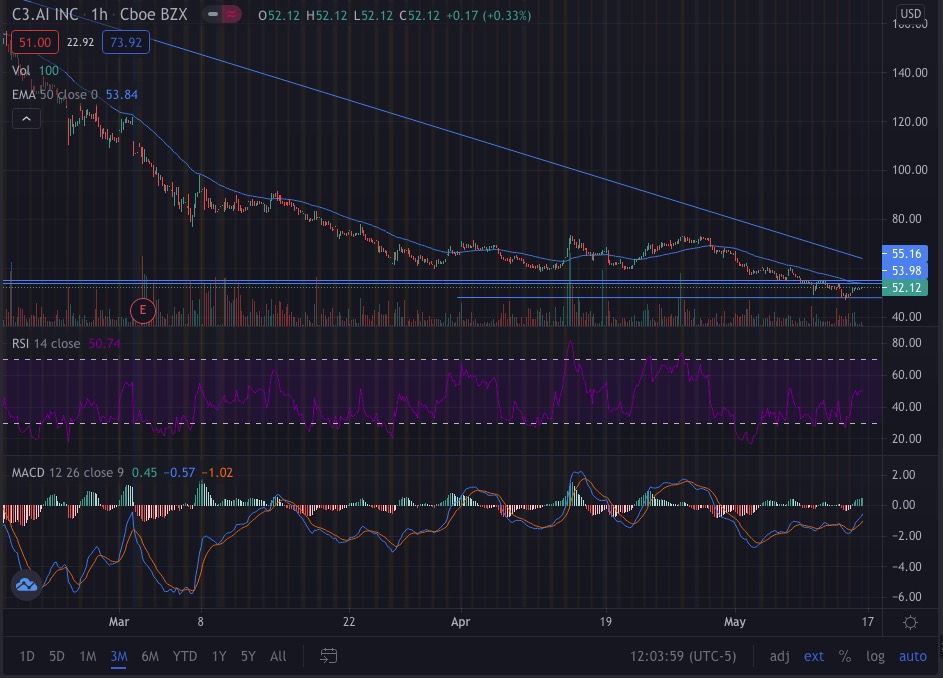
The overall trend from February has been downwards. There have been a couple of bounces but the pullback happened nonstop. The all-time low has been $47.
The RSI on the monthly chart is approaching the overbought line. But there is still some runway left in there. The MACD line is above the signal line, which is a positive buy signal and the MACD is positive as well. The 12-day EMA is above the 26-day EMA. The price is right on the 50-day EMA. This can go both ways. Either it may act as a future support, or as a resistance and drive the price down. I think that this will be a support.
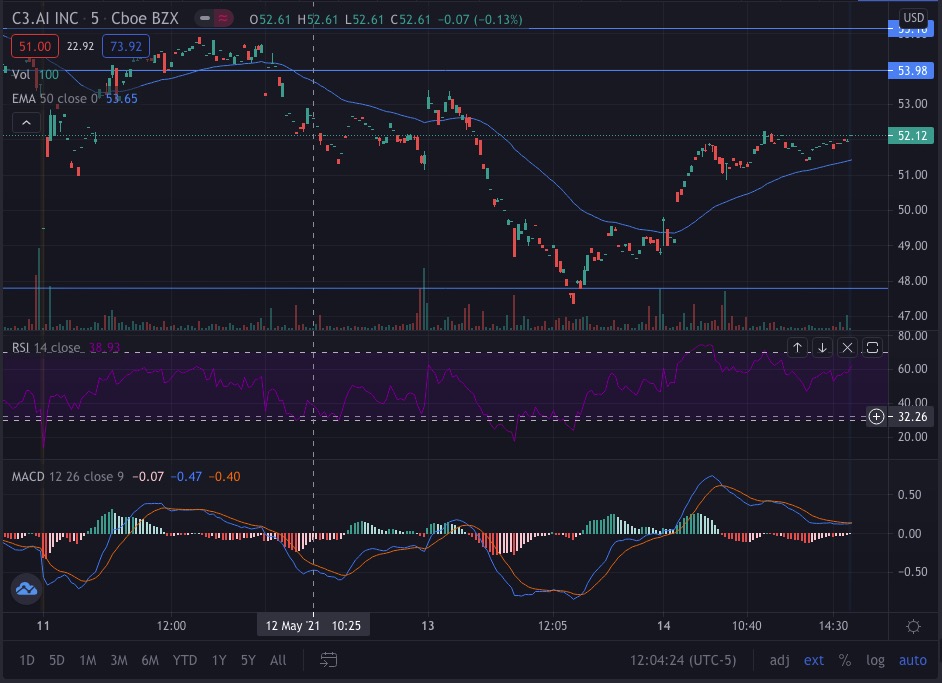
We can find this out by looking at the 5-day chart. Again the RSI is approaching overbought territory, but there is a runway left there. The MAC line has just started crossing over the signal line, which again is a buy signal. The price is above the 50 EMA here, which means we can hold the stock until it breaks its 50-EMA on the 5-day chart.
So here is the strategy I plan to use. If I have a portfolio of $1000 dollars and my risk tolerance is 2%. The maximum I can lose is $20. The current price is $52. If I have a stop loss at $50, then I can purchase 10 shares. This is the Iron triangle of Risk management.
AI: Buy 10 shares
Price: $520
Stop loss: $50
Sell at:
- When the price goes below the 50-EMA on the 5-day chart.
- When the RSI approaches oversold and the price posts a new daily low
- The MACD line crosses below the Signal line
Price Target: $62
Risk: $20
Reward: $100